Computer Graphics (GRK)
Lecture III
Colour in computer graphics
Our surrounding world is a world of colours. Thus the images that we want to generate using computers should be colour images. It occurs that the method of colour description suitable for computer application is not simple. It results from the notion of colour itself, which is not so obvious. During the lecture the notion of colour will be explained and different colour models used in computer graphics will be presented. We will pay attention to problem of portability of colour images and to the methods for solving it.
The notion of colour
The notion of colour is commonly applied. It is worth noting that the colour is not a feature of any physical object. It is human perceptual sensation resulting from stimulation of visual system by electromagnetic waves from visual spectrum. Visual sensations understood by the notion of colour results from an interaction of many factors such as type of light source, reflection coefficient of observed objects, observers' sensitivity to particular spectral wavelength. Final interpretation of incoming information and identification of perceived colour takes place in the brain. Colour is an attribute of visual sensations, thus all attempts to describe and specify colours encounter many difficulties. Many research have been done for a long time. Many colour models used in practice were developed, but the research is still continuing in order to achieve still better methods of colour description.
Colour theory is very extensive and includes many branches of science, wherein each branch develops the theory for its own needs and frequently uses its own vocabulary. Thus the terminology is not unified. Particularly it concerns the notion of colour, chromaticism and hue of colour. Here we assume that as it is in common language colour and chromaticism are synonyms. Hue of colour will define spectral colour in unique way. If there is no doubt we will repeatedly use just term colour instead of hue of colour. Below we limit ourselves to present selected problems associated with colour from the usefulness in computer graphics point of view.
Colour perception
Visual spectrum range includes waves with the length from 380 nm to 780 nm (approximate values). From physical point of view colour is this notion that corresponds to wavelength - different wavelengths in visual spectrum correspond to different colours. Colours associated with single wavelength are named as monochromatic. There also exist colour that cannot be assigned to single wavelength. For example purples are defined as combination of two wavelengths from opposite ends of spectrum, corresponding to blue and red colours. In Fig. III.1 the placement of selected colours in visual spectrum is shown.

Fig. III.1. Visual spectrum
Specified colour may be evoked by different combination of spectral components so called metamers. For example combination of waves 610 nm and 540 nm with chosen intensities will evoke the same colour sensation as single wavelength 575 nm.
From physical point of view all visible wavelengths are all an electromagnetic radiation, that differ in wavelength and frequency. The fact that we perceive waves with different length as different colour results only from the way of interpretation by brain, excitations received by photosensitive receptors in our eyes. These elements are cones and rods placed on the surface of retina.
Rods are sensitive to light in full range of visual spectrum. They are primarily receptors of „luminance” and they enable vision in low level of illumination (dark vision). While the cones are less sensitive and demand greater level of illumination (day vision). The cones enable perception of colour phenomena. Each of existing types of cones (L, M, S) is sensitive to particular range in visual spectrum. Peak sensitivities fall on the wavelengths that correspond to blue, green and red colours.
Because there are three types of receptors responsible for colour perception, we may expect than choosing three appropriate light sources and their percentage income we will get perception of desired colour. This observation underlies generation of colour images in displays, where we use sources of three primary colour R, G and B. The resultant colour is perceived on the additive mixing principle, which relies on stimuli adding.
In the case of printing, where absorption of light by pigments exists, we have to deal with subtractive method (differential). Here typical set of primary colours includes colours C (Cyan), M (Magenta) and Y (Yellow). It is worth noting that the concept of three primary colours is some simplification with respect to real human colour vision. The reality is more complex and in practice it is impossible to choose such three primaries that enables reproduction of all colours existing in nature.
Colour description methods
As it was mentioned above, the fact that the colour is perceptual notion and not physical, complicates the method of colour description. Frequently three ways to characterize colour are used.
- Trichromatic theory based on Grassman's law according to which each arbitrarily chosen perceptual colour may be defined by three linearly independent primary colours. That means that none of them can be obtained from the two remaining. Properly weighted combinations of primary colours create the metamers of perceptual colours.
- Opponent colour theory - the colour is coded by using three opponent components: R-G, B-Y, K-W. One dimension (blacK-White) corresponds to lightness, two remaining specifies chrominance and are not intuitive.
- Description based on observation that there exist three features influencing colour perception: hue of colour, lightness and saturation (Fig. III.2).

Fig. III.2 Illustration of notions characterizing the colour
Colour models
Grey scale
Before we will discuss different colour models let us pay attention to grey scale which include grey levels contained between Black and White. Most frequently we use 8 bit word for description of grey level. Thus we may use 256 grey levels. It is big enough number of levels, taking into account that average observer is able to distinguish about 100 grey levels.
Sample grey scale is shown in Fig. III.3.

Fig. III.3. Grey scale
RGB model
RGB model is based on assumption that three primary colours R, G and B are available. All colours that result from mixing these primaries are represented as points belonging to unitary cube defined in R, G, B coordinate system. The RGB model is shown in Fig. III.4. In the vertices of cube the colours R,G,B,C,M,Y and black K (blacK) and white W (White) are placed. On the diagonal connecting K and W vertices grey levels are located.


Fig. III.4. RGB colour model. In coloured version we see only colours on the surface of the cube
From computer graphic application point of view RGB models a discrete model. Each primary is represented by the word of certain length. For example if each primary is represented by 8 bit word then the colour point is represented on 24 bits. It means that the number of colours obtainable in this system is equal to 224, i.e. approximately 16.7 millions. It is a great number especially in context that average observer can distinguish about 10 millions of colours. Moreover we must remember that these are the colours obtainable by additive mixing of three primary colours R, G and B. Except there exists colours that cannot be obtained in this way and they are not included in RGB model.
CMY model
CMY model is similar to RGB model. It is also represented by unitary cube but placed in C, M, Y coordinate system. This model is shown in Fig. III.5. The model is discrete and does not represent all visible colours.

Fig. III.5. CMY colour model
CMY model is subtractive model used mainly in printing. Colour printed, for example, on paper and observed by human user result from subtraction from white light the parts of spectrum absorbed by applied ink (Fig. III.6).

Fig. III.6 Reflection of light from a paper covered by ink
In practice we use CMYK model, where (especially for printing process) additionally black colour is included. Then on prints we get better looking black colour than the black obtained from C,M,Y primary paints.
HSV model
In everyday speech for intuitive description of colour we use such notions as hue, saturation and lightness (see Fig. III.2). Hue is defined by the names of colours. Thus we speak about red colour, blue colour etc.
Saturation defines where given hue is placed between pure monochromatic colour (with saturation 100%) and white colour (saturation 0%).
Lightness (value) of colour intuitively defines perceptual intensity of light with given colour. This term enables distinction between dark and light colour, for example light pink and dark pink.
On the base of such intuitive description of colour HSV model was constructed. It is shown in Fig. III.7 (sometimes the model is represented in cylindrical form). In this model parameter H (Hue) defines the hue of colour expressed in degrees from 0º to 360º, parameter S (Saturation) defines saturation expressed either in the range 0 to 1, or in percentage from 0% to 100%. Parameter V (Value) defines the lightness (Value) in the range from 0 (for Black) to 1 (for White).
In HSV models on the perimeter of any horizontal cross-section lie saturated colours, Inside cross-section there are non saturated colours. The lightness is defined by the distance between cross-section and point K, which represents black colour. On the V axis grey levels are placed.

Fig. III.7. HSV model
Using HSV model it is relatively easy to choose H, S and V components defining desired colour. At first we may set hue of colour H, then choose the value of saturation S and lightness V. In this sense HSV model is considered to be intuitive. Many graphics application programs allows colour definition exactly in this model or in the derivative model HLS shown in Fig. III.8. In HLS model L component means lightness (Lightness).

Fig. III.8. HLS model
Obviously finally the colour obtained as a result of conversion to RGB model is displayed.
CIE XYZ model
Any of the models shown above does not represent all visible colours. The conducted research proved that there are no three colours from visual spectrum that enable design of model which would represent all visible colours.
In 1931 International Commission on Illumination (Commission Internationale de l'Eclairage - CIE in abbreviation) elaborated CIE XYZ model where as starting point three theoretical primaries X, Y and Z were accepted. They have no corresponding real, visible colours. The assumption for the model is to represent all visible colours. Pictorial view of CIE XYZ model is shown in Fig. III.9.
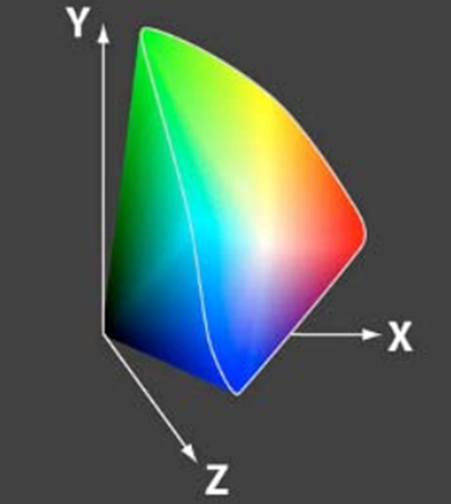
Fig. III.9. XYZ model
It occurred that the model is not very convenient for practical use. Thus CIE Commission defined more useful method of colour description. Each of X, Y, Z coordinates was divided by total light energy (X+Y+Z)

In effect we get three coordinates x, y, z which add up to 1. This condition results in conclusion that it is sufficient to use only two coordinates x and y to represent any colour. If necessary third coordinate may be easily calculated. Now the colour may be represented in x,y,Y model where Y represents (luminance).
In x,y coordinates the chromaticity diagram shown in Fig. III.10 was constructed.

Fig. III.10. Chromaticity diagram
All saturated spectral colours are placed on the curved part of perimeter of chromaticity diagram. On the line in lower part of diagram the purples are placed. The point W representing White colour is placed in the centre of diagram. Inside there are non saturated colours. In effect the diagram represents all visible colours (not taking into account the value of luminance).
Let us pay attention to ambiguity of common notion of white colour. In fact many different white colour and their definition exist. Some of them are base on the concept of black body radiator analysed in physics. For example so called white D6500 is a colour of black body radiator heated to the temperature 6500 K. It correspond to the daylight at cloudy day . Equienergetic white E has coordinates . White C represents sun light at high noon .
Chromaticity diagram has the following feature. If we mark on the diagram the placement of two colours (for example A and C on Fig. III.11) then the colour resulting from mixing initial colours will line on line segment connecting these colours (for example colour B in Fig. III.11). In consequence, if we mix three colours then the resultant colour will lie inside the triangle which has initial colours in its vertices. It is shown in Fig. III.11.

Fig. III.11. Point representing colour B resulting from mixing A and C colours lie on line segment connecting points representing A and C colours. Points representing a colour resulting from mixing three initial colours lie inside the triangle, which has initial colours in its vertices
In chromaticity diagram we may illustrate different colour models based on primary colours. Particularly we may present RGB model as shown in Fig. III.12. All colours represented in RGB model lie inside the triangle which has R, G and B colours in its vertices. It is not hard to see that outside the RGB colour triangle there exist many other visible colours. It means that if we identify the colours of vertices with the RGB colours of real display then we will never see the colours from outside the triangle on this display. We also may notice that any other set of three visible colours does not enable obtaining all visible colours.

Fig. III.12. RGB model on chromaticity diagram
xyY colour space except its advantages has some drawbacks, namely it is not perceptually uniform. It means that the same changes of values of parameters do not correspond to the same change of perceived colours. In order to remove this defect CIE Commission in 1976 transform parameters x, y into u’, v' parameters defined as follows:

In Fig. III.13 modified u'v' chromaticity diagram is shown.

Fig. III.13. CIE u’,v’ chromaticity diagram
L*a*b* model
In 1976 CIE also elaborated the model based on opponent colour theory. Its genesis is derived from the observation that we do not meet such terms as redish-green or yellowish-blue, wherein we may perceive the colours that are the combinations of red and blue colour or green and yellow.
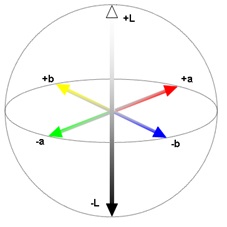
Fig. III.14. L*a*b* model
Model L*a*b* is shown in Fig. III.14. Particular components represent respectively: L* - lightness (0 - 100), a* - placement between red and green colours (-128 ÷ 128), b* - placement between blue and yellow colours (-128 ÷ 128).
The advantage of this model is ease of colour comparison. Differences between colours are defined similarly to distance between points in Euclidean 3D space.
Additionally CIE XYZ and CIE L*a*b* models are device independent.
Colour management systems
In computer graphics we deal with different devices which enables image capturing in digital form (scanners, digital cameras) or image reproduction (displays, printers). Each may have different set of available colours - colour gamut (see Fig. III.15). In such situation the reproduction with high fidelity may become hard or even impossible task.

Fig. III.15. Sample two colour gamuts of two devices on x,y chromaticity diagram
Brute force solution is to limit colour gamuts to common area and then use this limited set of colours only.
Other solutions use the concept of colour model standardization, assuming that all users will use accepted colour model. In Fig. III.16 two such standards are presented: model sRGB (HP and Microsoft) and Adobe RGB. (White D65 corresponds to the colour of black body radiator heated to the temperature 6500 K).
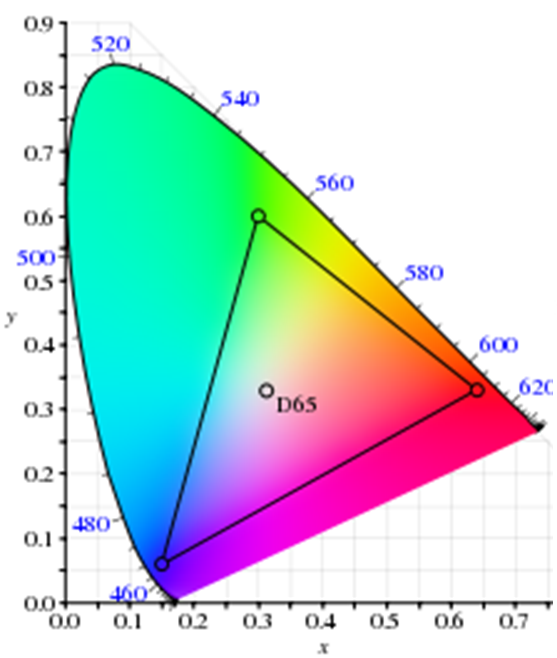
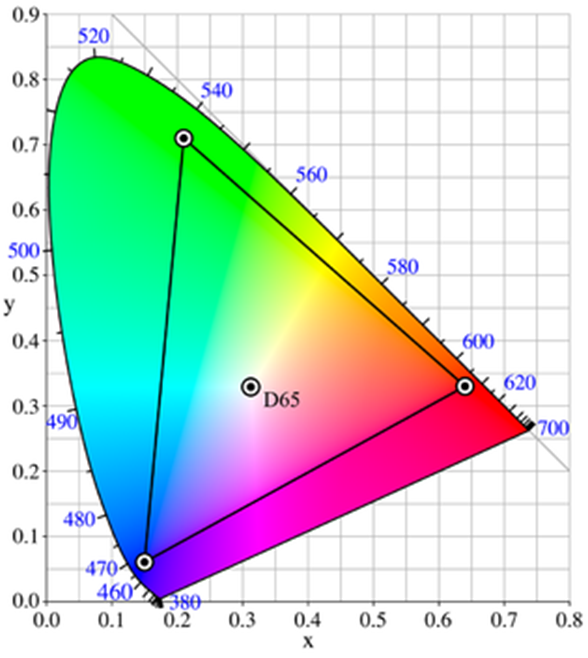
Fig. III.16.Colour models: a) sRGB, b) Adobe RGB
There exists known and used in practice Colour Management Systems (CMS). In these systems the principle is to store each image in single common colour space which is independent on used devices. Such space may be one of spaces defined by CIE Commission (XYZ or L*a*b*). In turn for each device so called device profile is defined. It enables transformation between colour model of given device and accepted common colour space. System works as follows. The image generated on device is sent along with the device profile to the system, where it is converted to common colour space and stored in this form. In turn the device on which the image will be reproduced sends its profile to the system. It enables system to perform conversion of stored image to colour model of image reproducing device.
In this lecture the problems concerning colour definition and description in the context of computer graphics were presented. The problems appearing during displaying or reproduction of colours on different devices were shown. The role of Colour Management Systems was explained.
Questions and problems to solve.
- What are monochromatic colours?
- What is hidden behind the notion „metamers”?
- Please justify the thesis: „RGB model used in computer graphics is a discrete model”.
- Whether is it possible using three primary colours R, G and B to obtain any given visible colour?
- Please discuss chromaticity diagram.
- Please explain the role of Colour Management Systems.